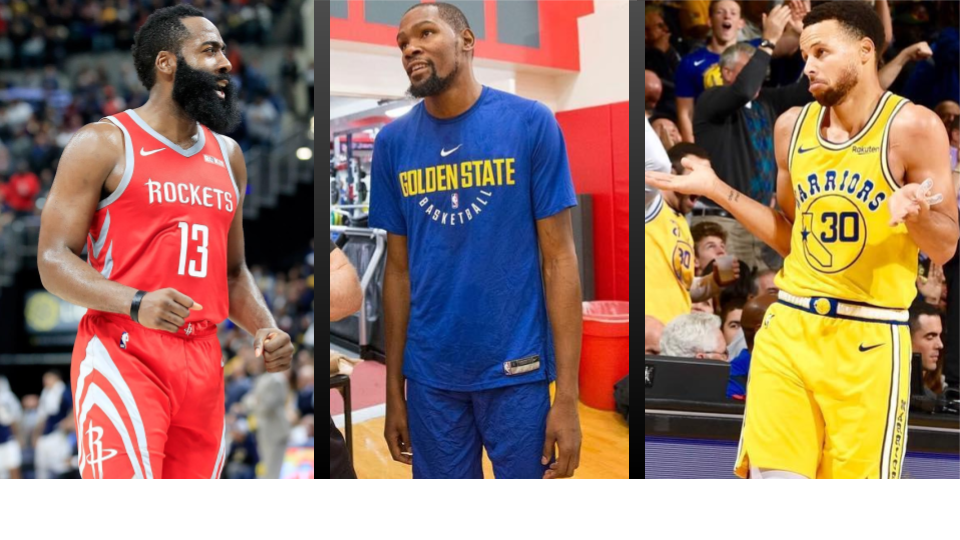
In the second round of the 2019 NBA Playoffs, fans were treated to a particularly riveting rematch of last year’s Western Conference Finals, between the Golden State Warriors and Houston Rockets. To jog your memory, last year the Warriors won the series in seven. And this year, the Warriors won in six.
However, disregarding the dramatic 2018 series, this playoff series was still incredibly interesting. First, these two teams are the winningest teams in the Western Conference over the past two years, with Houston winning 118 games, and Golden State winning 115.
Second, the star power in this series cannot be matched, with the series including four of the last five MVP trophies.
Kevin Durant won MVP in 2014 while Stephen Curry won in 2015 and 2016 and James Harden won in 2018.
Thirdly, and most prominently, what makes this series so interesting is how different both teams play despite being the two most successful teams in the Western Conference over the past two years.
Looking at team numbers
This season, the Warriors led the league in assist percentage, at 66.8 percent. The Rockets were 28th at 54.1. The Warriors led the league in cutting frequency at 10.3 percent. The Rockets were 26th at 5.9 percent. In summary, Golden State is beautiful, free-flowing and subtle. Houston is rugged, stagnant and intense.
Harden’s Ideology
This comparison carries over to the three aforementioned stars. Each is a certifiable star while approaching the game with clashing intents. The causal power of his team, Harden spends most of his time with the ball in his hands isolating. There, he takes an unwavering methodology: get to the rim or get a three and try to get fouled in the process. That’s it. His hyper-analytical style has allowed him to score an otherworldly 36.1 points per game this season. The most since Michael Jordan scored 37.1 per contest in 1986-1987.
Durant’s Ideology
Meanwhile, Durant, a basketball purist, does not care about traditionally efficient shots. Mostly because almost every shot he takes is an efficient shot. Thus, while Harden strays away from the mid-range, taking one per game on a 42 percent clip, Durant flourishes there, shooting a league-leading 55.1 percent on 5.9 attempts per game.
“I don’t like at all,” Kevin Durant said on The Bill Simmons Podcast.
A statement that makes complete sense coming from a walking anomaly. However, much like Harden, Durant led his team in isolations per game. Harde isolations are the Rockets’ game plan, with Harden spending 16.4 possessions per game in isolation, Durant isolations are the Warriors’ monkey wrench, with Durant spending 3.7 possessions per game isolating.
Lastly, there’s Stephen Curry. He’s not sturdy like Harden or stretchy like Durant, and thus he only sees 1.3 isolations per game. Instead, Curry spends much of his time running off screens for three balls, coming off screens a second in the league 4.8 possessions per game. He is generally considered to be the best three-point shooter of all time, with a best of all time 3.6 three-pointers made per game. And this season he was first in the league in pull up three-point percentage among those who shot 41 or more, at 41.5 percent. He was also eleventh in catch and shoot three-point percentage on a first in the league 6.7 attempts per game, at 44.6 percent. And first in wide open three-point percentage, at 52.5 percent.
Thinking of the three stars’ differing styles, I stumbled upon an interesting statistical hypothetical: what if each of the three were to play like each other? How would Curry and Durant play if they adopted the same -based style of Harden? How would Curry and Harden play if they let it fly from the mid-range like Kevin Durant? What if Durant and Harden took as many catch-and-shoot threes as Curry? Thus, I took my contemplation to Google Sheets, and formulated a method to calculate this.
Methodology
Before I start, I would just like to say that I am in no way claiming that my results are a perfectly accurate representation of how many shots player x would make if he took the exact same shots as player y, with the same defensive coverage. That is mathematically impossible to calculate. Instead, through data on NBA.com, I have tried to calculate how each player does on each player’s shot selection based on the following categories: restricted area field goal attempts, non-restricted area paint field goal attempts, mid-range field goal attempts, catch-and-shoot three-point attempts, pull up three-point attempts and free throw attempts. As well as shot selection, I also included how many turnovers players would get if they had as much time of possession as another player by dividing player x turnovers by player x time of possession and multiplying that by player y time of possession.
I also originally tried to include how many assist points created player x would get in player y’s role. However, with assists being as much about the shooter as they are about the passer, I did not include them.
Alternatively to this method, I did originally try to include how each player would do using each other’s play types, such as pick and roll handler, isolation, handoff, etc. This does not look at how player x would do with player y’s shot selection, but instead how player x would do with player y’s opportunities. However, due to concerns of small sample size, I did not include it, as that would not be accurate at all.
The final calculation entitled “Effectiveness” is total points, added up from the aforementioned player y field goal attempts on specified shots, multiplied by player x’s field goal percentage minus the aforementioned turnover equation, multiplied by league average points off turnover, which is approximately 1.17. If you don’t like reading math, the basic equation is this:
PTS-(TOV*Lg Average PTS off TOV)
Basically, the equation is how much player x scores with player y’s shot selection minus how many points player x allows offensively with player y’s time with the ball per game.
It’s also noteworthy to mention that when adding up how player x did on player x’s shot selection, there somehow were decimal differences between the points per game spit out by the equation, and their actual points per game. However, they’re pretty insignificant, so I wouldn’t pay too much mind to them.
Got it? Okay. Let’s get started.
Playing Like Harden
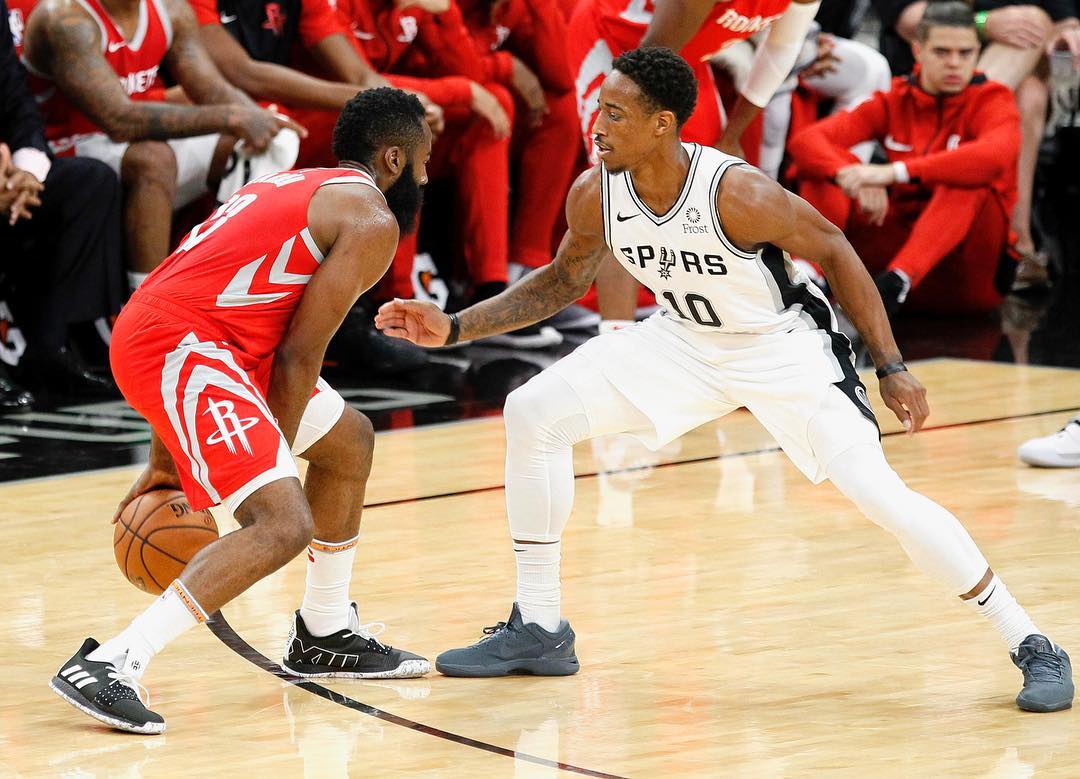
Harden’s Per Game Tendencies:
6.7 Restricted Area Field Goal Attempts
3.6 Non-Restricted Area Paint Field Goal Attempts
1 Mid-Range Field Goal Attempt
.9 Catch-and-Shoot Three-Point Attempts
12.1 Pull Up Three-Point Attempts
11 Free Throw Attempts
5 Turnovers on 9.3 Minutes of Possession
Results
Effectiveness Ranking:
- Stephen Curry: 32.6
- James Harden: 30.1
- Kevin Durant: 29
Points Ranking:
- Stephen Curry: 38.9
- Kevin Durant: 36.5
- James Harden: 35.9
How Curry Would Play
Much of the reason why Stephen Curry overtook James Harden with Harden’s own tendencies is because Curry is a much better pull up three-point shooter. While Harden shot 36.3 percent on pull ups this season, as previously mentioned, Curry shot 41.5 percent. Thus, Curry got 1.9 more points per game on pull up three-point attempts than Harden. Other contributors were Curry’s 62.8 percent field goal percentage in the restricted area to Harden’s 58.8 percent, and Curry’s 91.6 percent free throw percentage to Harden’s 87.9 percent. In fact, the only category in which Harden did better than Curry on was turnovers per 9.3 minutes of possession. For while Curry got 5.4, Harden got five.
However, while I could see Curry being more successful playing like Harden than Harden is, it would also be a gross overstep for Curry to play like Harden on the already star-studded Warriors. In fact, in a conversation with Harden, Curry even found out that Harden only plays as ball-dominantly as he does because it is necessary to the success of his team.
However, say that somehow the Warriors did lose three members of their big four this offseason, I could see Curry succeeding in a Harden-type role. But still, there are a couple issues. Firstly, with Curry’s long injury history, I would not trust his durability as much as I do Harden’s. For in his ten year career, Harden has played 95.1 percent of his team’s regular season games, while Curry has played just 86.3 percent. Secondly, with Curry being thirty pounds lighter than Harden, I doubt he would be able to take on the amount of contact Harden does at the rim, which is why Harden shot 6.7 shots in the restricted area, while Curry shot just 3.4 this season.
How Durant Would Play
While Durant did outscore Harden by .6, his turnovers made him last on the effectiveness ranking. For Harden had 5 turnovers per 9.3 minutes of possession, and Durant had 6.4. However, what made Durant outscore Harden was his ability to score in the paint. For in the restricted and non-restricted area, Durant outscored Harden by 2.2. This made up for Durant’s last of the three 31.1 pull up three-point percentage.
And while Durant could definitely succeed in a Harden-like role, I do think that Durant’s own shot selection fits him better. This is why Kevin Durant’s true shooting percentage was 63.1 percent this season and would be 62.7 percent if he had Harden’s tendencies. Furthermore, because he would turn the ball over more with Harden’s time of possession, working him off the ball more makes sense in that respect.
How Harden Plays
Despite being second of three on this list, Harden is very much best suited of the three to be in a Harden-like role, due to aforementioned physicality concerns with Stephen Curry. However, he did end up only coming in second because within two-point range, he came in last on every shot category. This gave him 1.4 less points on twos than Curry, and 5 less points on twos than Durant. He also only came in second for both three-point categories, with Curry coming in first.
However, much of the reason why Harden was the most effective offensive player in the league this year by 1.52, according to offensive real plus-minus, is because he had the most analytical shot selection in the NBA. He was able to find traditionally efficient shots more than anyone else in the NBA. Even if he is not necessarily exceptional at taking those traditionally efficient shots. It is his approach and on-court manoeuvring that make him so effective. Not his ability to make hard shots. This is why he was worse than both Curry and Durant at making tightly contested shots this season.
Playing Like Durant
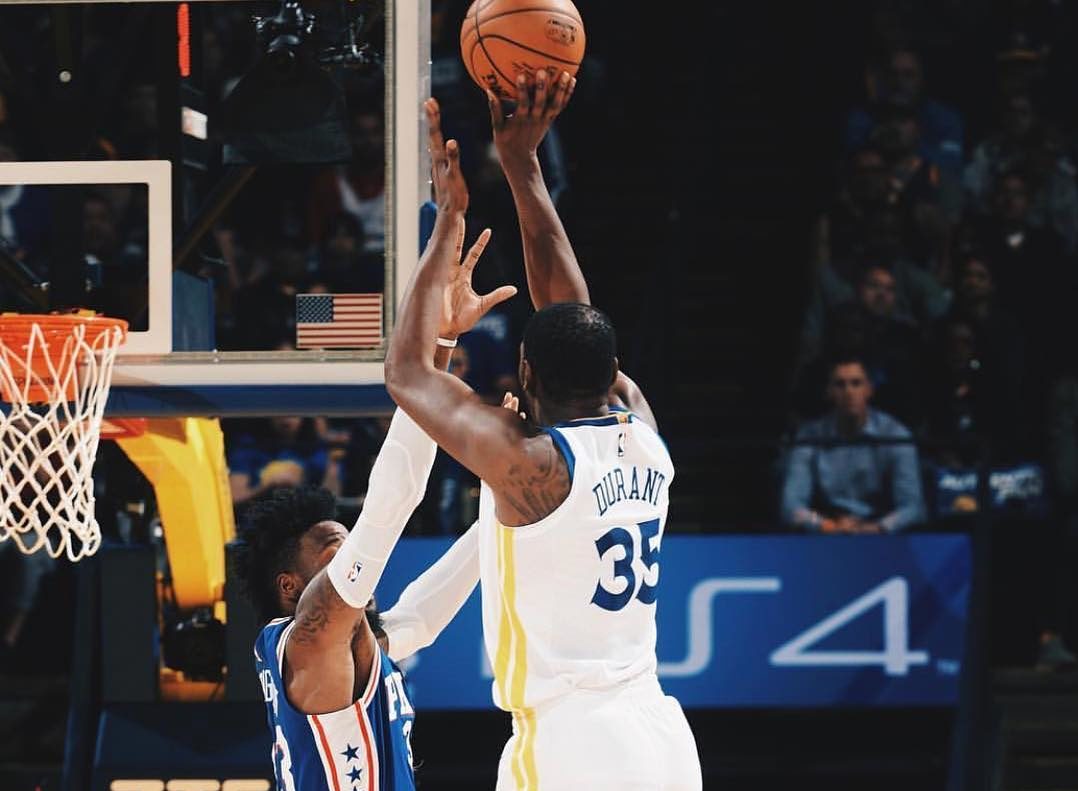
Durant’s Per Game Tendencies:
3.6 Restricted Area Field Goal Attempts
3.2 Non-Restricted Area Paint Field Goal Attempts
5.9 Mid-Range Field Goal Attempt
2.2 Catch-and-Shoot Three-Point Attempts
2.7 Pull Up Three-Point Attempts
6.5 Free Throw Attempts
2.9 Turnovers on 4.2 Minutes of Possession
Results
Effectiveness Ranking:
- Kevin Durant: 22.5
- Stephen Curry: 22
- James Harden: 20.8
Points Ranking:
- Kevin Durant: 25.9
- Stephen Curry: 24.8
- James Harden: 23.4
How Curry Would Play
Being that Curry is a better two-point scorer than Harden, it makes sense why Curry would have 1.1 more points than Harden from two-point range. And being that Durant is even better than Curry, it also makes sense that Durant would outscore Curry by 4.6 in two-point range. With Durant taking 28.1 percent of his shots from three, compared to Curry’s 60.4 percent or Harden’s 53.9 percent, Curry’s biggest strength was majorly deemphasized as well. However, Curry’s superior three-point shooting did contribute to why Curry was just .5 away from Durant in effectiveness, as well as his less turnovers.
As previously mentioned, Durant’s ability to hit mid-range shots is an anomaly. At seven feet, he can pretty much shoot over most of the smaller wings that defend him, making contests less effective as they are with Curry. This is why Durant shoots 9.1 percent higher on mid-range jumpers. Therefore, it wouldn’t make much sense for Curry to forfeit more efficient shots for Durant’s mid-range-heavy style.
How Harden Would Play
With the worst two-point scoring of the three, no wonder why Harden was last on this list. Similarly to Curry, he did beat Durant on threes, but once again because Durant plays a more two-point oriented game than either of them, Harden’s stronger three-point game is less important. Much like with Curry, having Harden play like Durant would compromise what makes Harden so great in the first place. However, Harden would still be an All-Star level player if he played like Durant, with a 57.3 percent true shooting percentage, as only 20 players this season have had a higher true shooting percentage on 15 shots or more.
How Durant Plays
Unlike Harden, who succeeds because he has the ideal shot selection for the majority of perimeter players in the NBA, Durant succeeds because no one should be shooting the shots he does. For as mentioned before, Durant has somehow made mid-range shots at a very efficient rate, which can’t be said for the vast majority of the NBA. In this way and many others, Durant is a unicorn.
Playing Like Curry
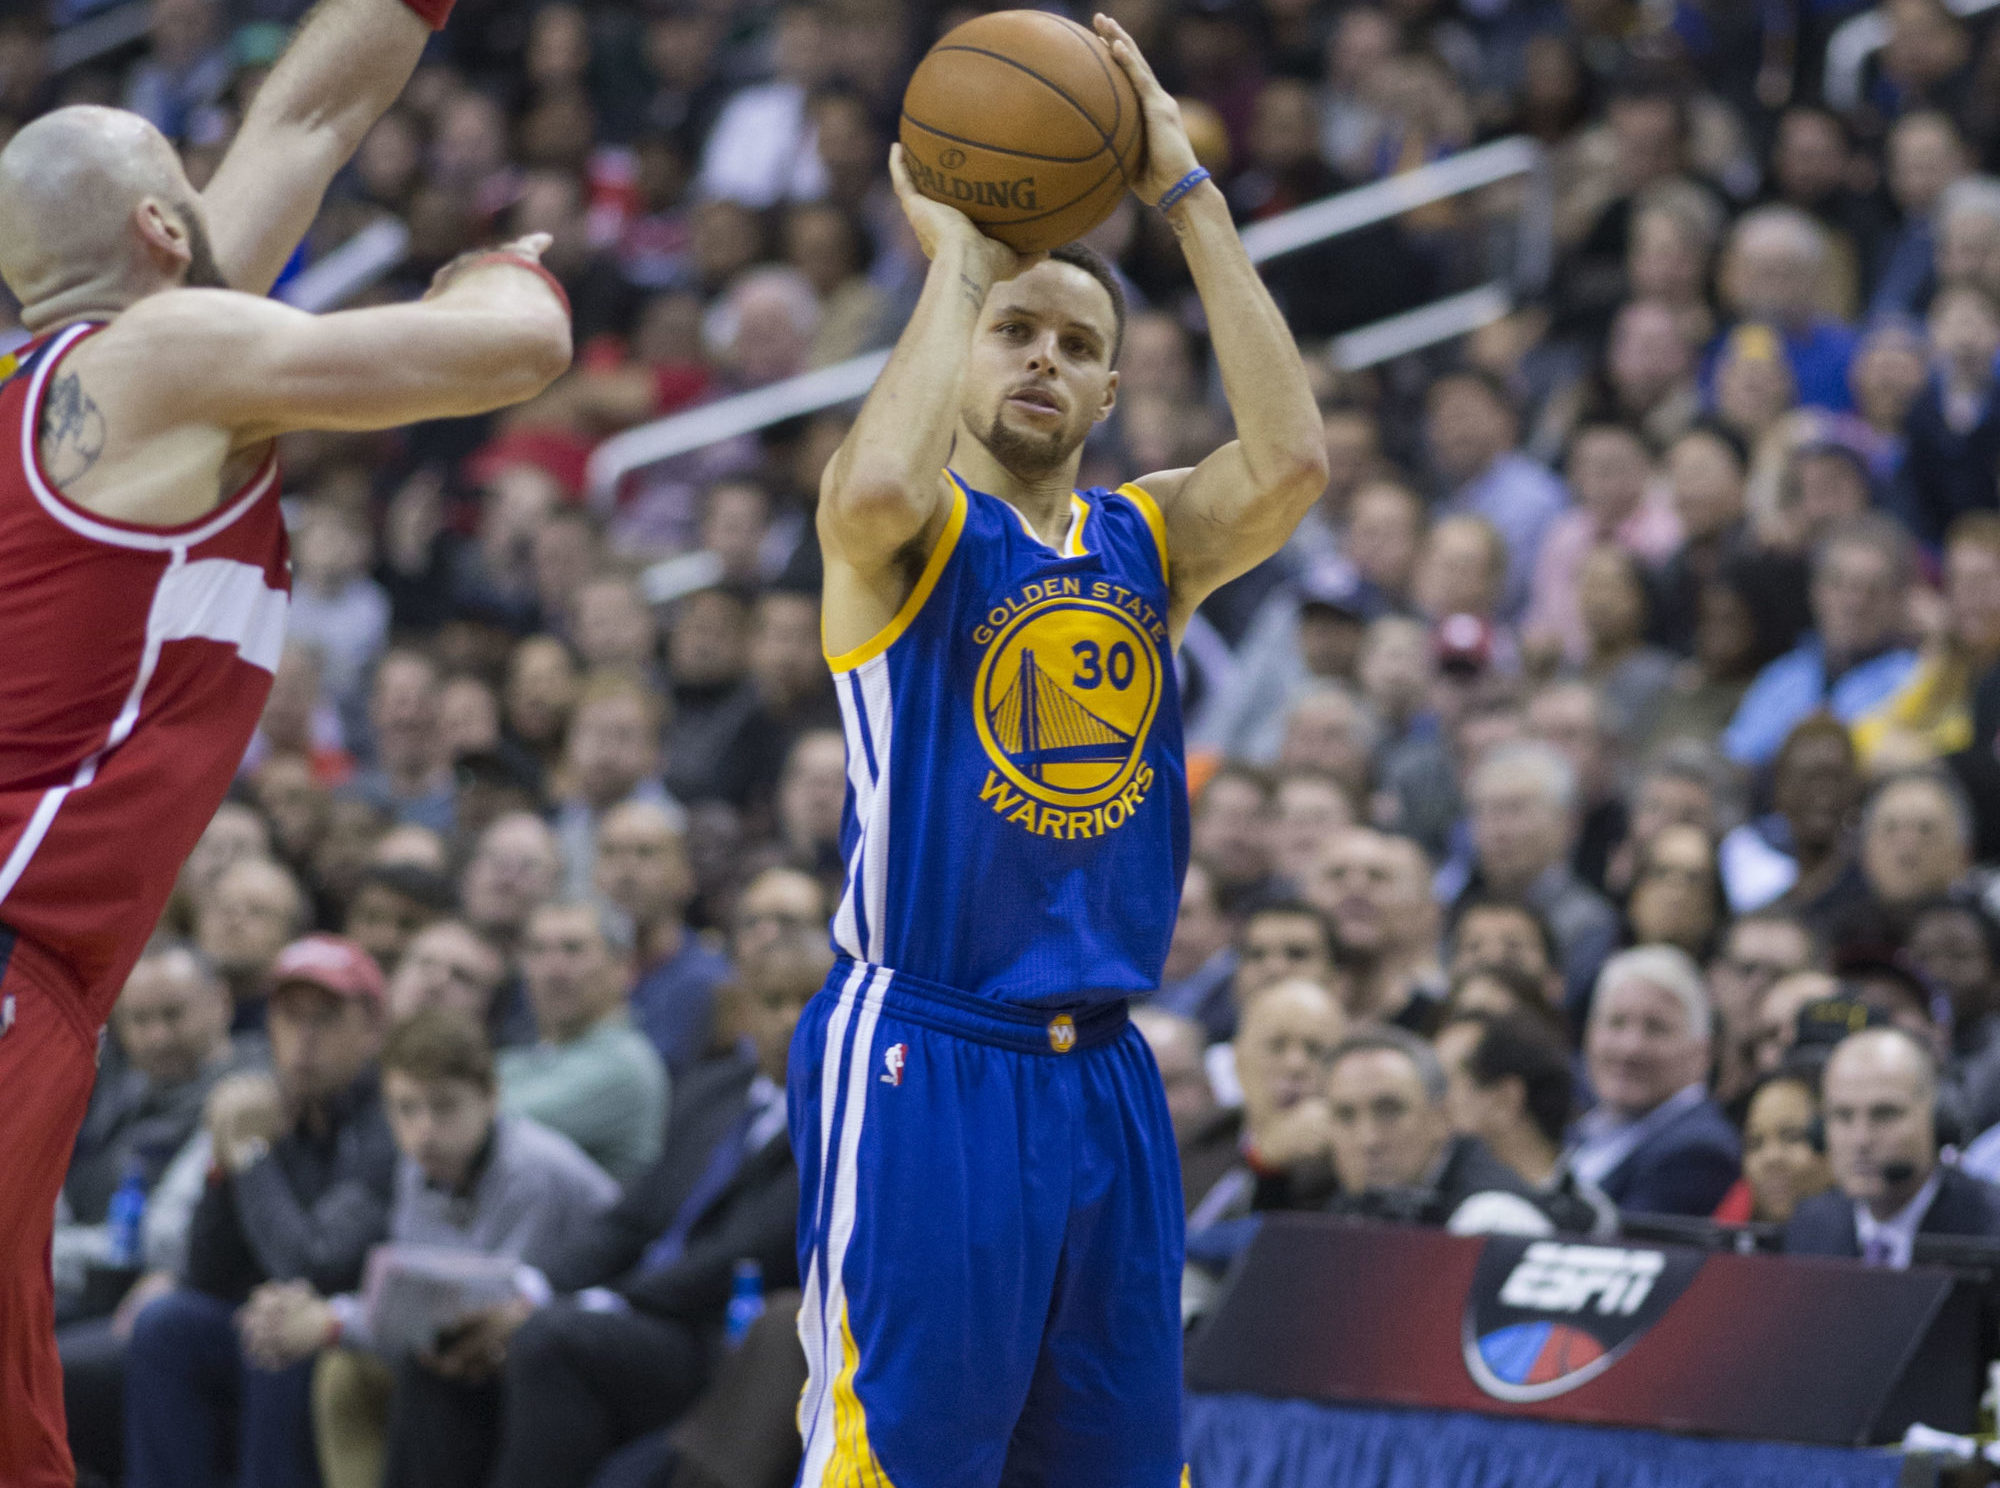
Curry’s Per Game Tendencies:
3.4 Restricted Area Field Goal Attempts
1.4 Non-Restricted Area Paint Field Goal Attempts
2.8 Mid-Range Field Goal Attempt
6.7 Catch-and-Shoot Three-Point Attempts
4.9 Pull Up Three-Point Attempts
4.2 Free Throw Attempts
2.8 Turnovers on 4.8 Minutes of Possession
Results
Effectiveness Ranking:
- Stephen Curry: 23.6
- Kevin Durant: 22
- James Harden: 21.9
Points Ranking:
- Stephen Curry: 26.9
- Kevin Durant: 25.9
- James Harden: 25
How Durant Would Play
Despite Durant being the worst three-point shooter of the three this year, his ability to hit twos once again puts him above Harden, with 3.6 more points from two-point range. Furthermore, with Durant’s ability to hit threes off screens, scoring in the 84th percentile on off the screen points per possession this season, I do think that he could succeed in this role. However, much like I said how Durant would get the ball too much in a Harden-like role, I do not think he’d get it enough in a Curry-like role. Once again, his true shooting percentage would decline, this time by 1.6 percent, and as a seven footer with guard-like skill, many of his points come from breaking down mismatches.
How Harden Would Play
To be clear once again, if Harden played exactly like Curry, he would still be an All-Star per this equation. He is still very much good enough from deep, and would put up a 59.3 percent true shooting percentage in this scenario. However, not only is this the wrong role for Harden from a production perspective, but Harden also just isn’t as fluid of an athlete as Curry, nor is he nearly as quick from three. He certainly can’t move off of screens as quickly as Curry. And despite leading the league in attempts, he has a pretty unexceptional release time. Meanwhile, Curry and even Durant to an extent have quite quick triggers. Thus, running Harden off screens is likely not the best idea.
How Curry Plays
Do I really need to tell you something you’ve probably known since his rookie season? Curry’s a world class shooter guys. But something that sometimes goes under the radar is just how fast he is. We don’t see him as the type of on-ball sprinter that guys like Russell Westbrook and De’Aaron Fox are. And he certainly doesn’t have their hops.
However, off of screens, there is no one quicker than Stephen Curry. He’s like a stunt driver getting around anything put in front of him, despite how unlikely it may seem. That is why he has been top five in off screen possessions per game since the stat has been available on NBA.com. To put it simply, no one can move off of screens like him.
In Conclusion
Surprise surprise, Harden, Durant and Curry have each chosen approaches that make the most sense for their skill sets. Harden’s craftiness has allowed him to get to the most efficient areas of the floor. Durant’s size has allowed him to take advantage of the mid-range. And Curry’s shot and speed have allowed him to spend a lot of time moving off of the ball for threes. In this way, Harden, Durant and Curry are the perfect counter to anyone who believes that the NBA has lacked stylistic diversity.
All statistics are from Basketball-Reference.com, ESPN.com and NBA.com
JTNDZGl2JTIwY2xhc3MlM0QlMjdzMm5QbGF5ZXIlMjBrLWxNU21mTUNyJTI3JTIwZGF0YS10eXBlJTNEJTI3ZmxvYXQlMjclM0UlM0MlMkZkaXYlM0UlM0NzY3JpcHQlMjB0eXBlJTNEJTI3dGV4dCUyRmphdmFzY3JpcHQlMjclMjBzcmMlM0QlMjclMkYlMkZlbWJlZC5zZW5kdG9uZXdzLmNvbSUyRnBsYXllcjMlMkZlbWJlZGNvZGUuanMlM0ZmayUzRGxNU21mTUNyJTI2Y2lkJTNEODU0NyUyNm9mZnNldHglM0QwJTI2b2Zmc2V0eSUzRDAlMjZmbG9hdHdpZHRoJTNENDAwJTI2ZmxvYXRwb3NpdGlvbiUzRGJvdHRvbS1yaWdodCUyNyUyMGRhdGEtdHlwZSUzRCUyN3MyblNjcmlwdCUyNyUzRSUzQyUyRnNjcmlwdCUzRQ==[/row]
For quality up-to-date sports reporting, visit our website, like us on Facebook, and follow us on Twitter and Instagram.


